Bibliothèque
Data visualizations and infographics

Services

Ressources

Espaces

Horaires
We apologize this page has not been translated yet. You can use this tool to browse our website in any language.
07
October
2015
Nouveau livre

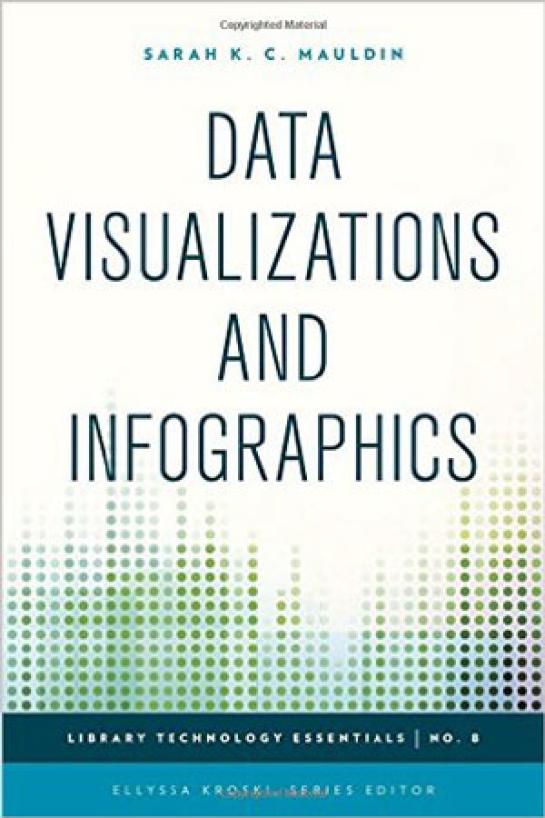
"Graphics which visually represent data or complex ideas are oftentimes easier for people to understand and digest than standalone statistics. A map shaded with different colors to represent religious affiliations or income levels enables researchers to quickly identify trends and patterns. New free tools and applications offer librarians the opportunity to organize and manipulate data to quickly create these helpful graphics". [extrait de la 4e de couverture]
Notice bibliographique
MAULDIN, Sarah K. C. Data visualizations and infographics. Lanham : Rowman & Littlefield, 2015. 119 p. Library technology essentials, no. 8. ISBN 9781442243873
 Évènements